

National Housing
Report
REMAX July 2026 National Housing Report
Updated Monthly · Next Report: August 2026
The July 2026 REMAX National Housing Report is out, and there is an important takeaway for anyone thinking about buying OR selling. Across the 46 metro areas surveyed, inventory increased 2.8% from June and 4.7% from a year ago, while the median sales price held steady at $450,000, still 3.4% higher than last year. More homes on the market means more choices for buyers and more competition for sellers.
Key findings from the July 2026 report.
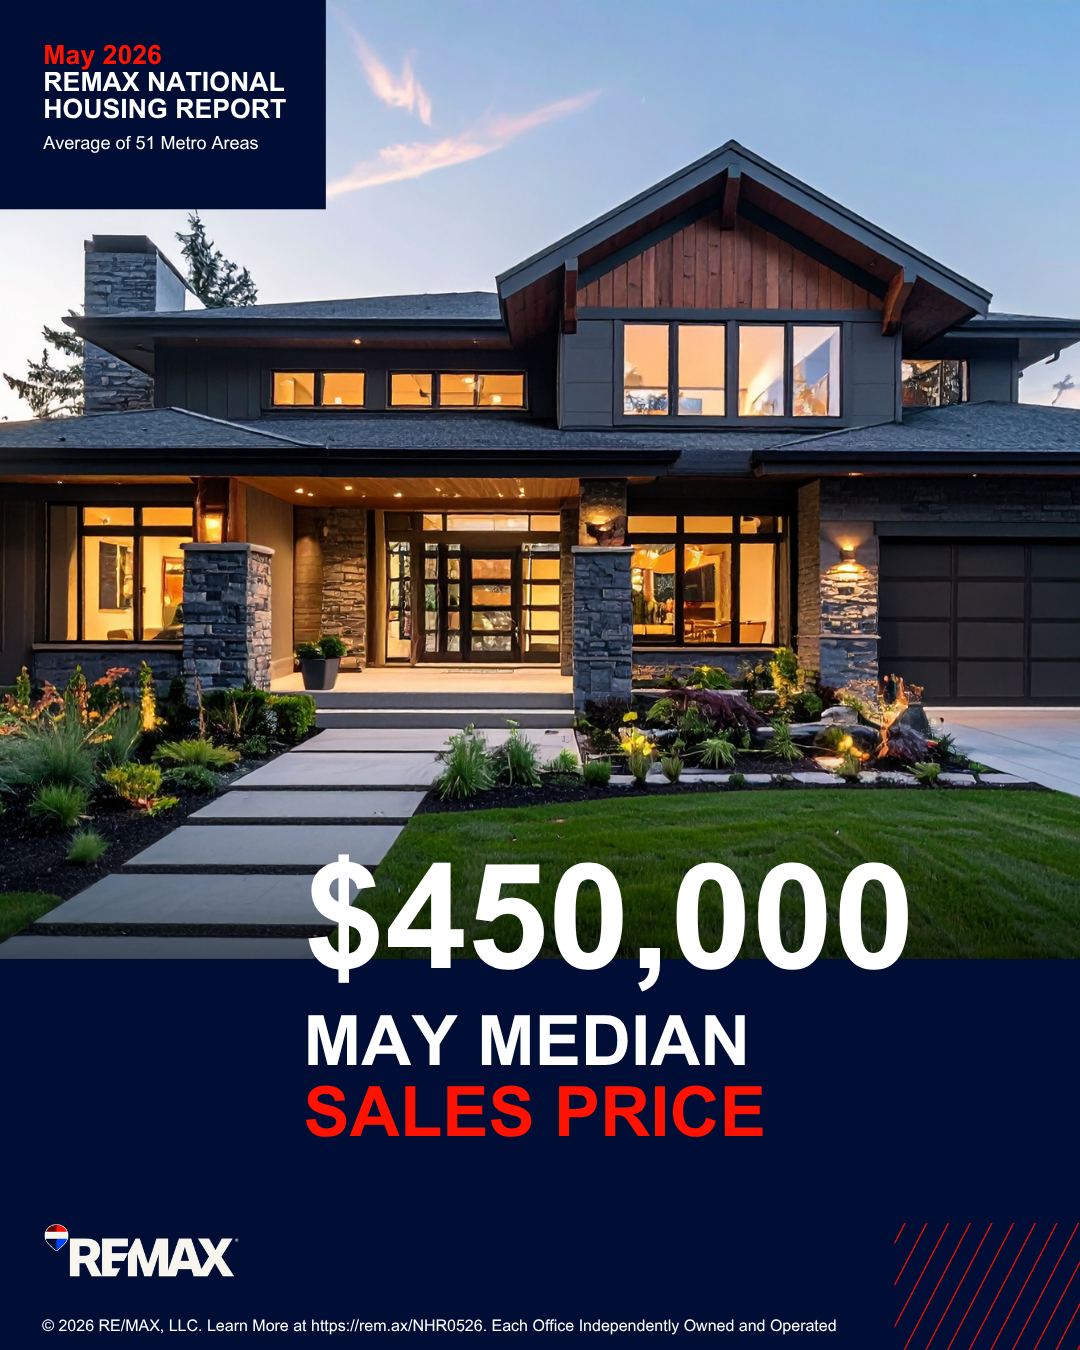
Median Sales Price $450,000
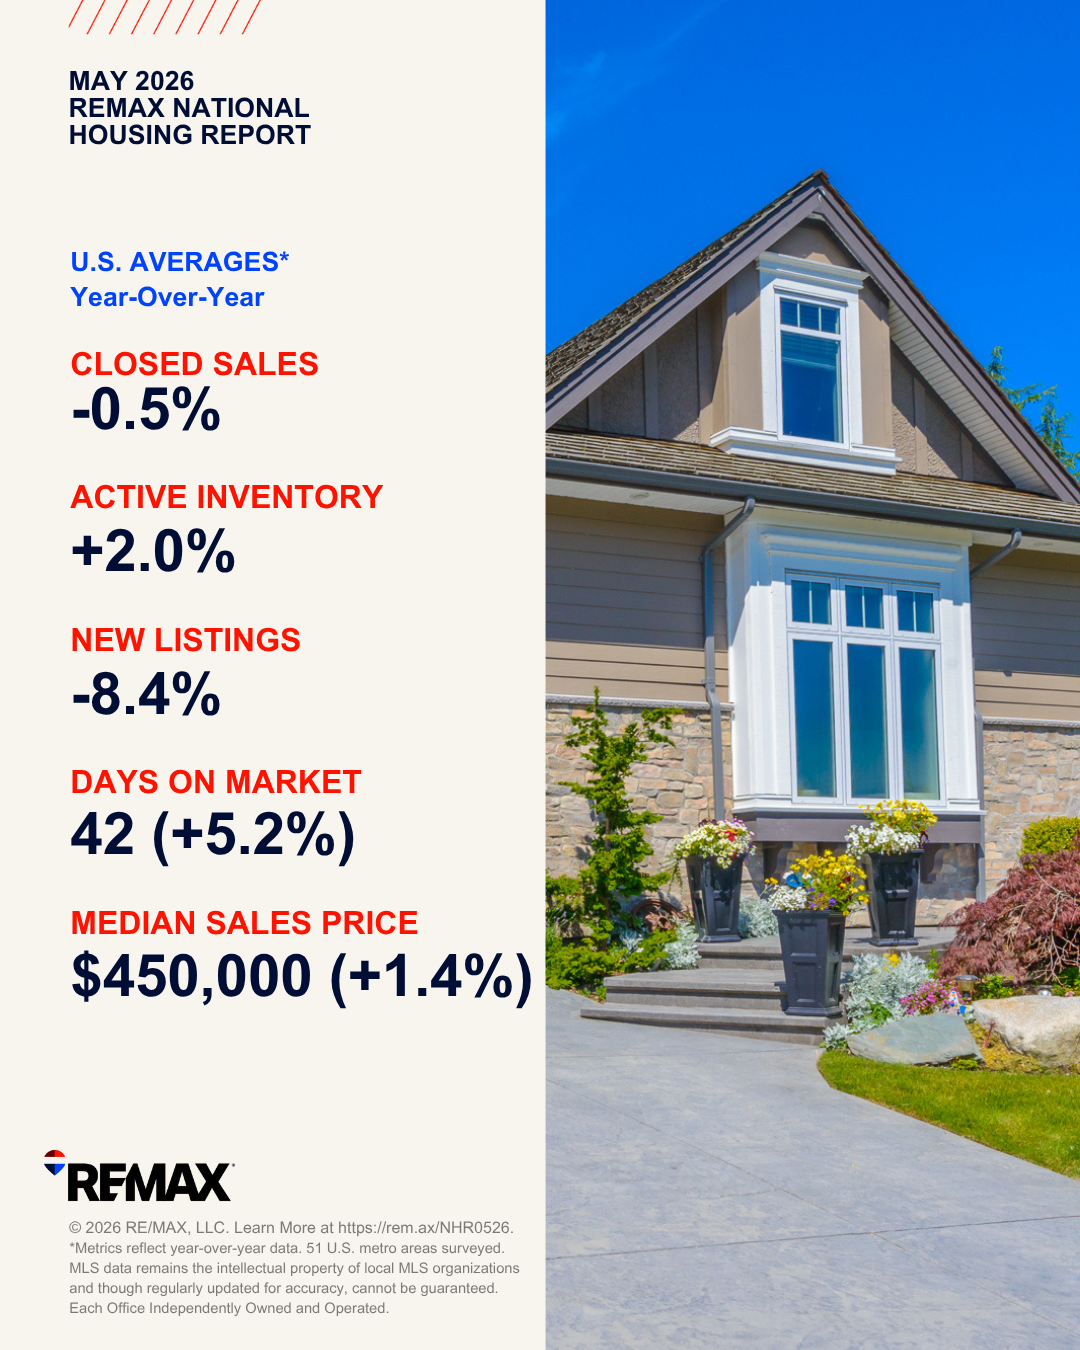
Closed Sales, Active Inventory, New Listings, Days on Market, Median Sales Price
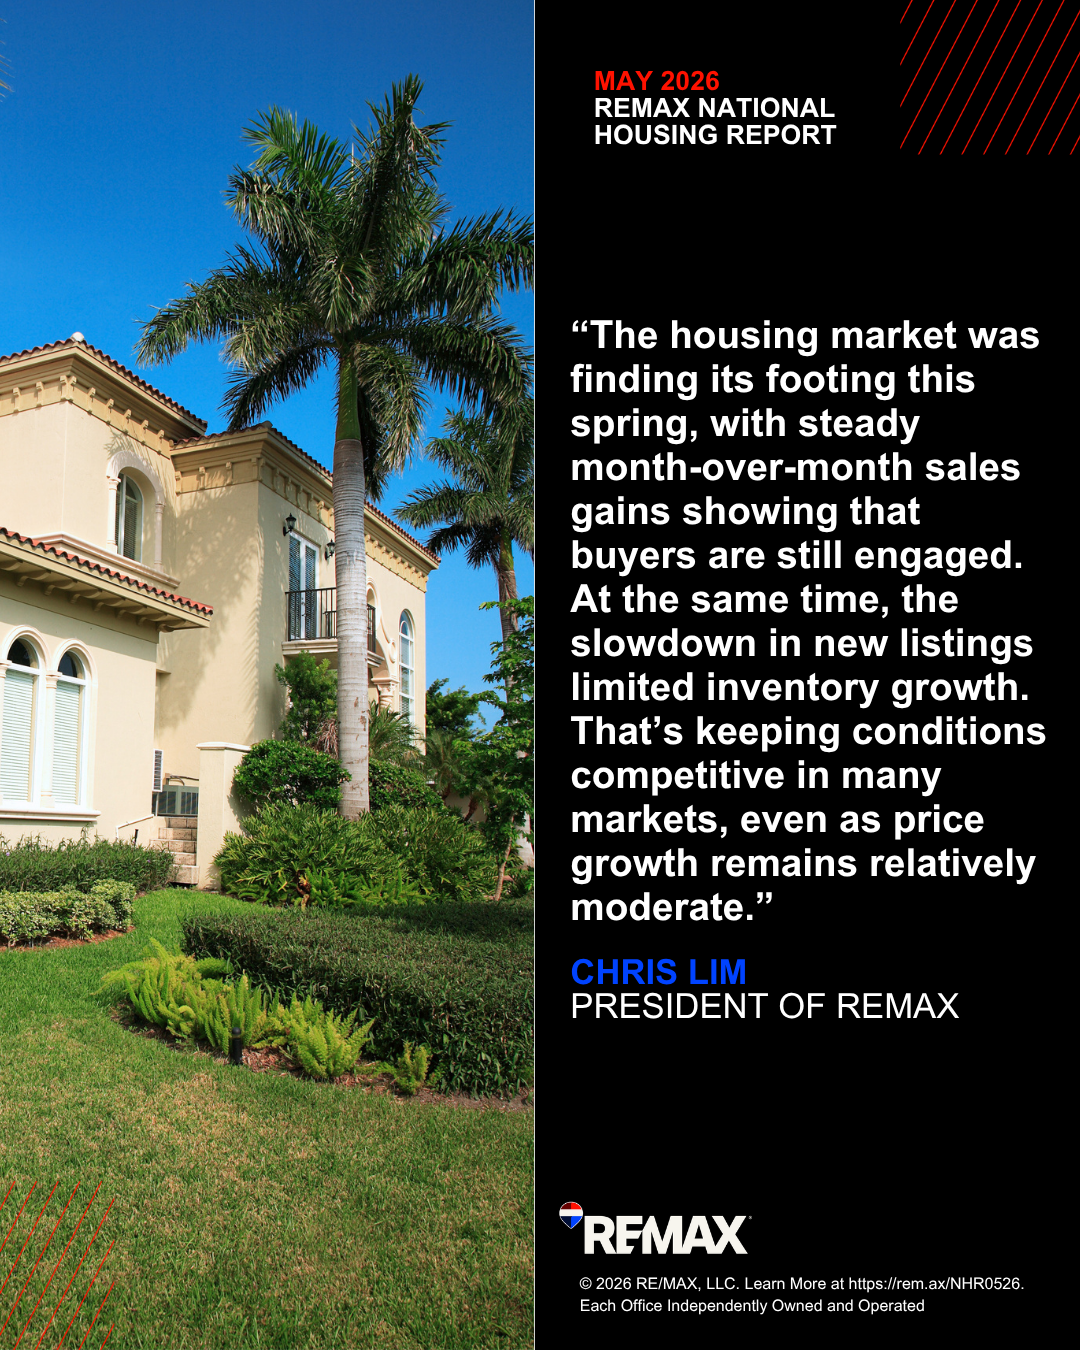
Chris Lim, President of REMAX
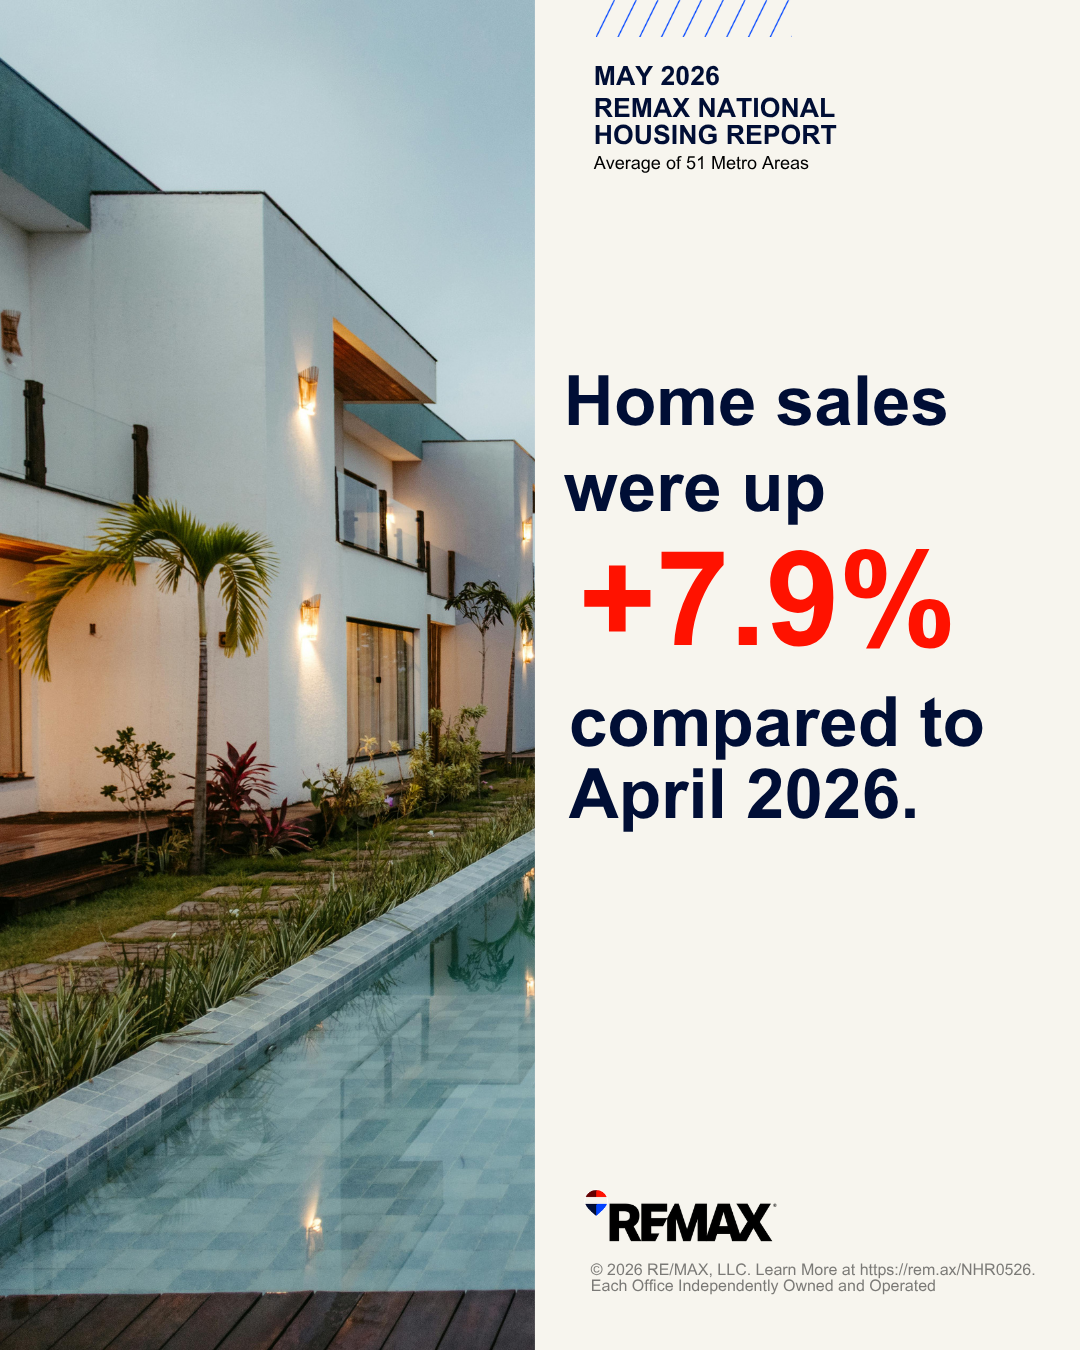
Home Sales Up +7.9% Compared to April 2026
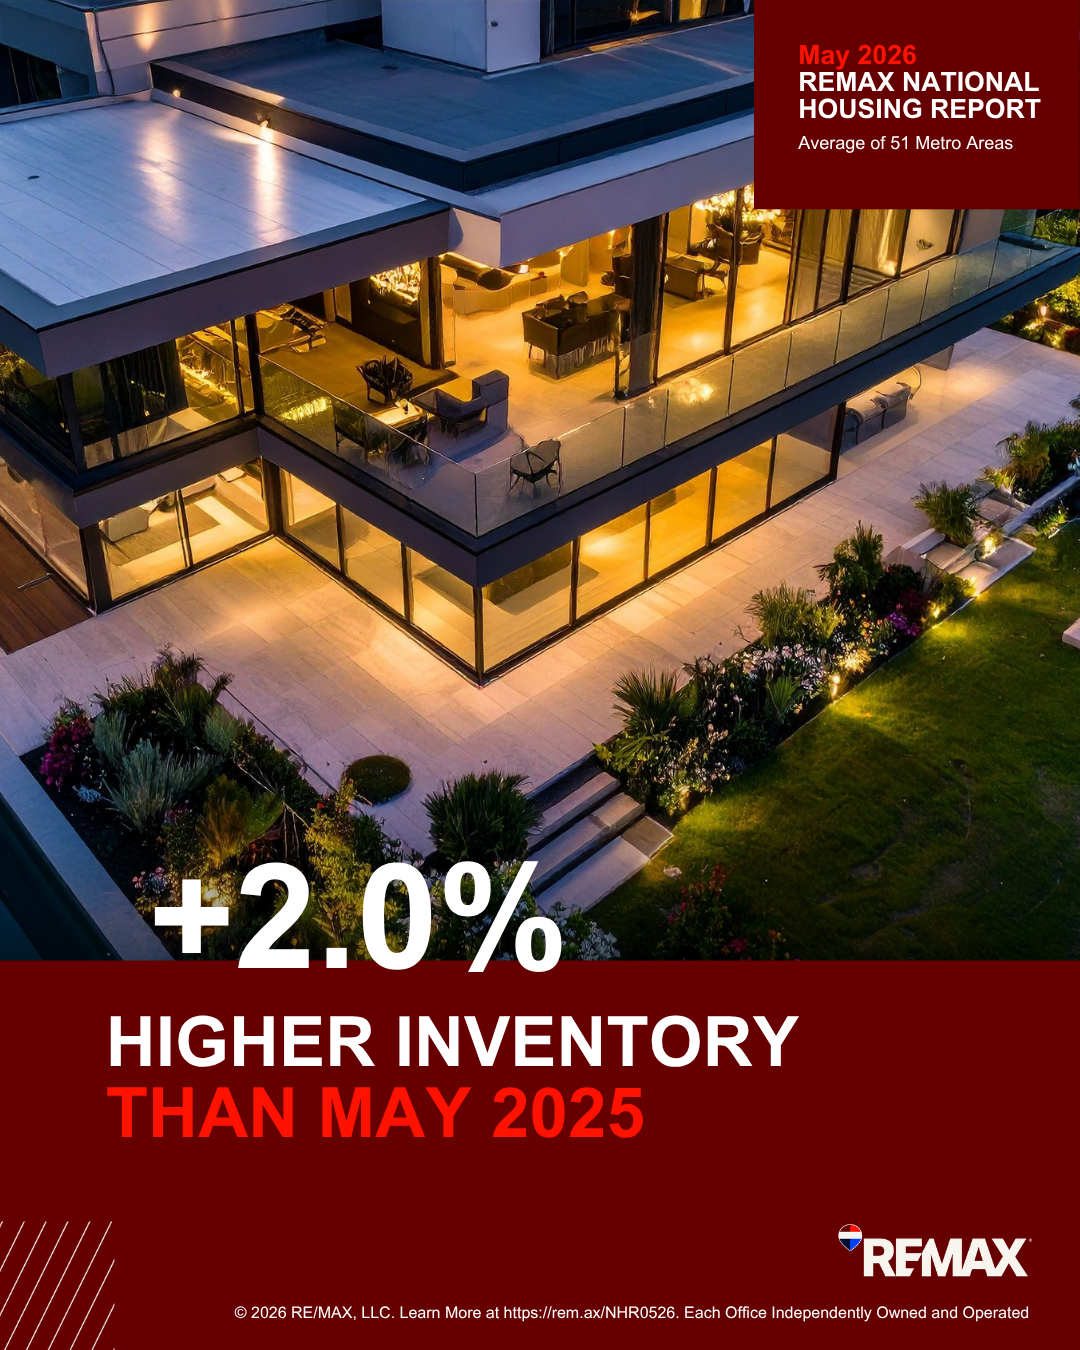
Higher Inventory Than May 2025 (+2.0%)
July 2026, 46 Metro Areas Surveyed
National housing data across 46 U.S. metro areas surveyed by REMAX.
More inventory is giving buyers something they have not had enough of in recent years: CHOICES. More choices for buyers means more competition for your home. Pricing, condition, presentation, marketing, and negotiation strategy are becoming increasingly important.
For Buyers
More homes to consider can mean more negotiating opportunities and less pressure to settle. Take your time, compare options, and make an informed decision.
For Sellers
More choices for buyers means more competition. Your home does not need to be the only choice. It needs to be the BEST choice. Pricing and marketing matter more than ever.
What the July 2026 numbers tell us.
Inventory Trends
Across the 46 metro areas surveyed, active inventory increased 2.8% from June and 4.7% from July 2025. The year-over-year gain reflects continued expansion in the number of homes available for sale, giving buyers more choices than they have had in recent years. While inventory is growing, it remains below pre-pandemic levels in many markets, and the pace of new listings coming to market varies significantly by region.
The median sales price held steady at $450,000 month over month, a sign of market stability rather than significant price declines. Prices remain 3.4% higher than July 2025, indicating continued appreciation at a more moderate, sustainable pace compared to the double-digit gains of the pandemic era.
Price Trends
The median sales price held steady at $450,000 month over month in July, a sign of market stability. Prices remain 3.4% higher than July 2025, indicating continued moderate appreciation.
Full Metrics Summary
Want to see how these national trends compare to your local market?
Contact Lisa for a personalized market analysis. She provides complimentary, data-driven insights backed by real-time MLS data and deep knowledge of every Chateau Elan neighborhood and the surrounding Northeast Metro Atlanta market.
Source: REMAX National Housing Report, July 2026. Data based on 46 U.S. metro areas surveyed. MLS data remains the intellectual property of local MLS organizations.
Next monthly update: August 2026 report

Ready to Explore
Château Élan?
Lisa Harris has nearly two decades of experience in Château Élan and Northeast Metro Atlanta luxury real estate. Whether you're buying your dream home or preparing to sell, she'll guide you with the expertise only a community insider can offer.
Licensed Georgia Real Estate Agent · CLHMS GUILD™ · REMAX Center